Tallinn Design Week 2024
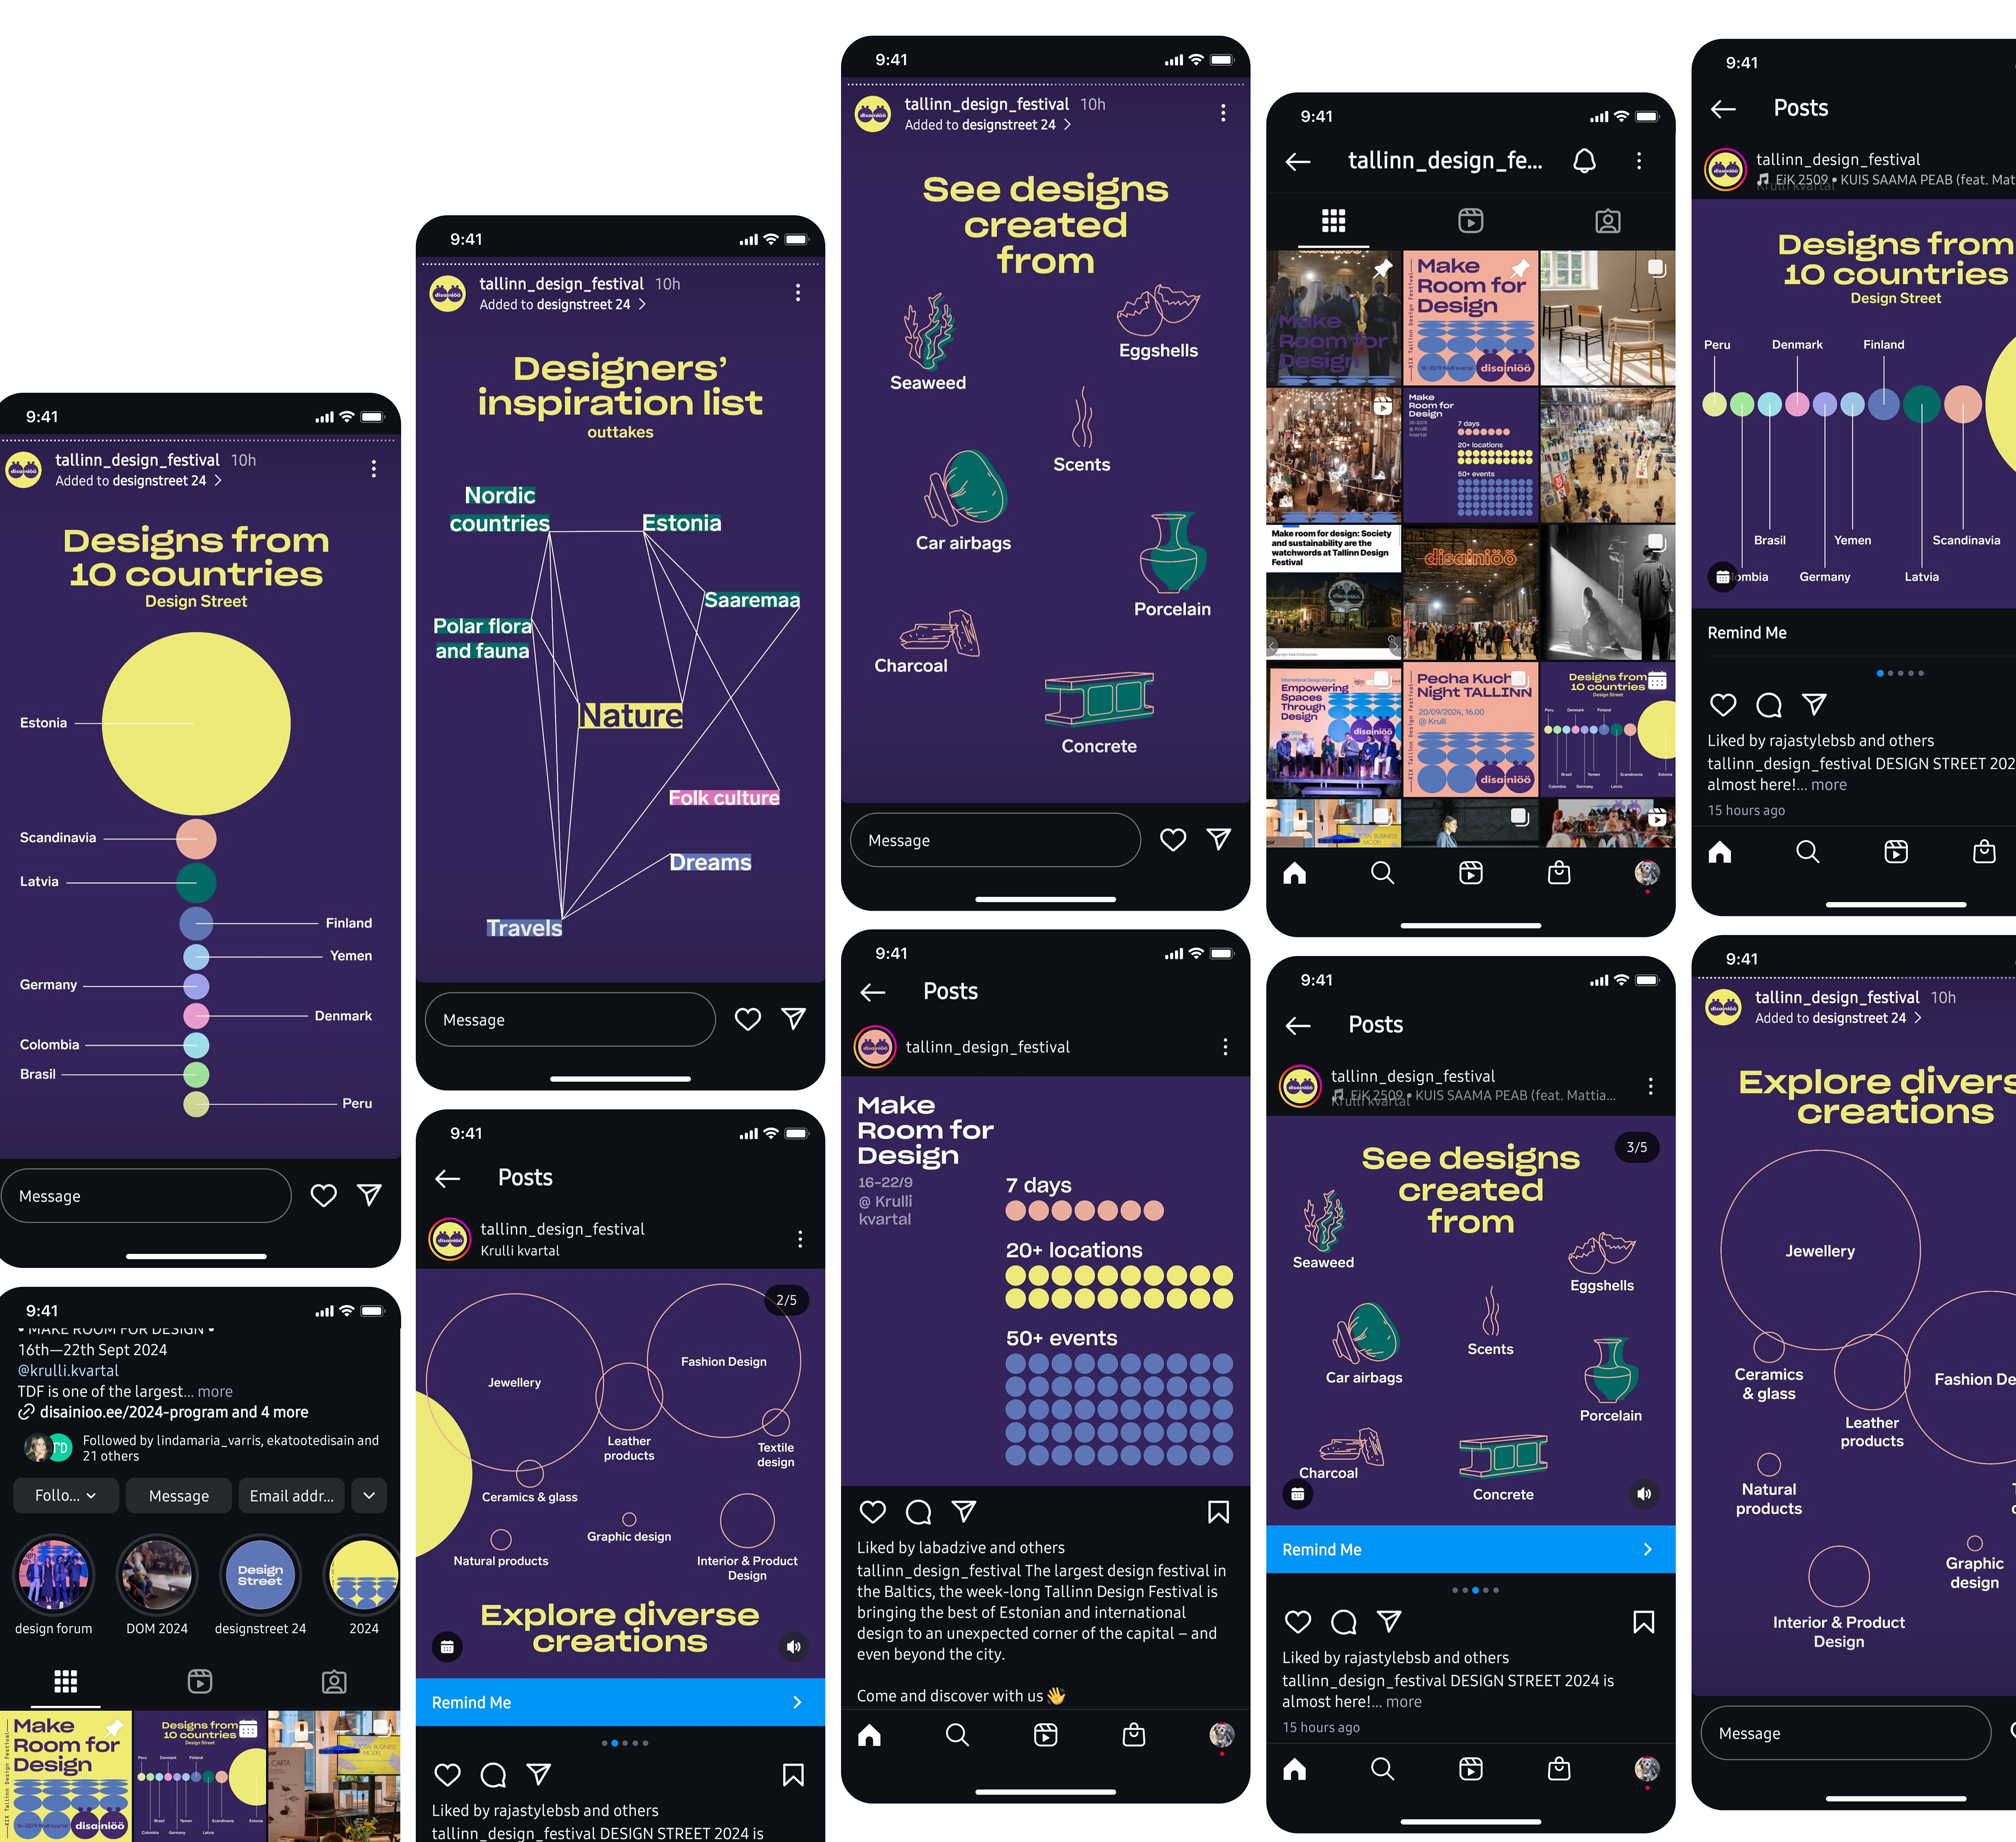
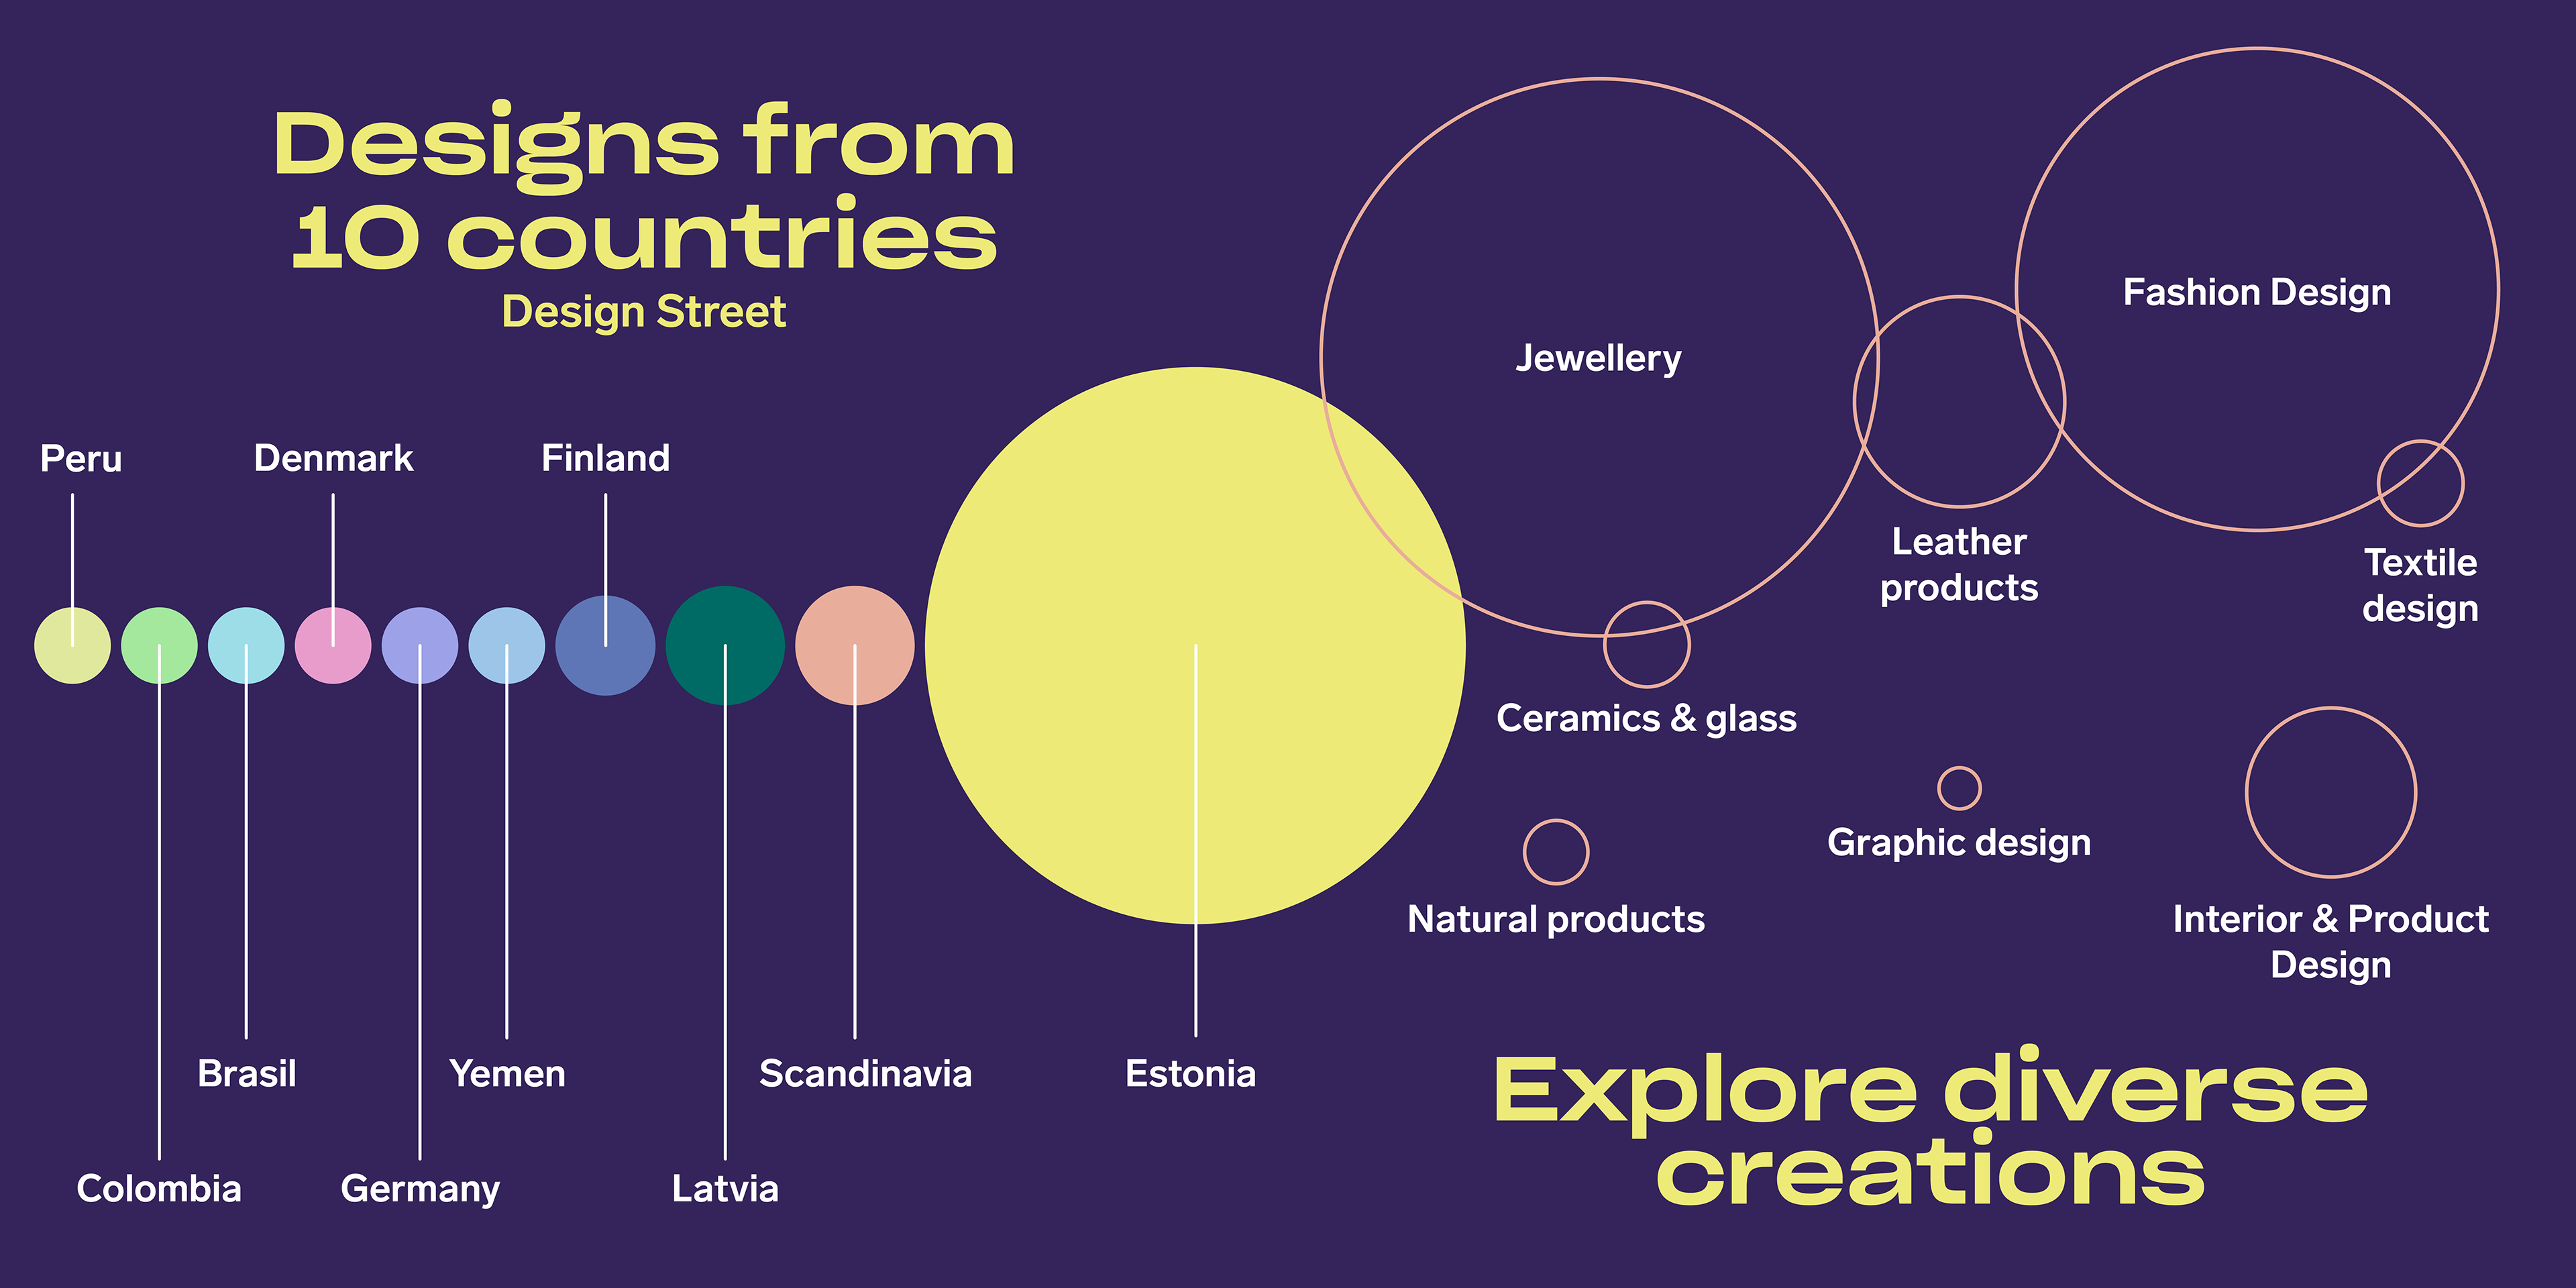
The visualizations provide a clear overview of the artists and designers showcased at Design Street 2024, helping attendees discover new talent and navigate the event more effectively. Additionally, documenting and presenting this data creates an archive of the festival’s creative landscape, offering insights into trends and participation over time.
data visualization
details
Tallinn Design Week, Estonia 2024

CONTEXT
Tallinn Design Week is an annual celebration of Estonian and international design. What began as a small event has evolved into a week-long festival featuring conferences, talks, and diverse exhibitions. Each year, the festival revolves around a central theme, reflecting a key topic in the design scene at that moment.
A major highlight of the festival is Design Street - a large art and design fair showcasing artists and designers from various disciplines. Since the lineup of vendors changes each year, it would be valuable to document who will be featured, where they come from, and what they create. This led to the idea of sharing this information in advance through social media, generating excitement and engagement ahead of the event.
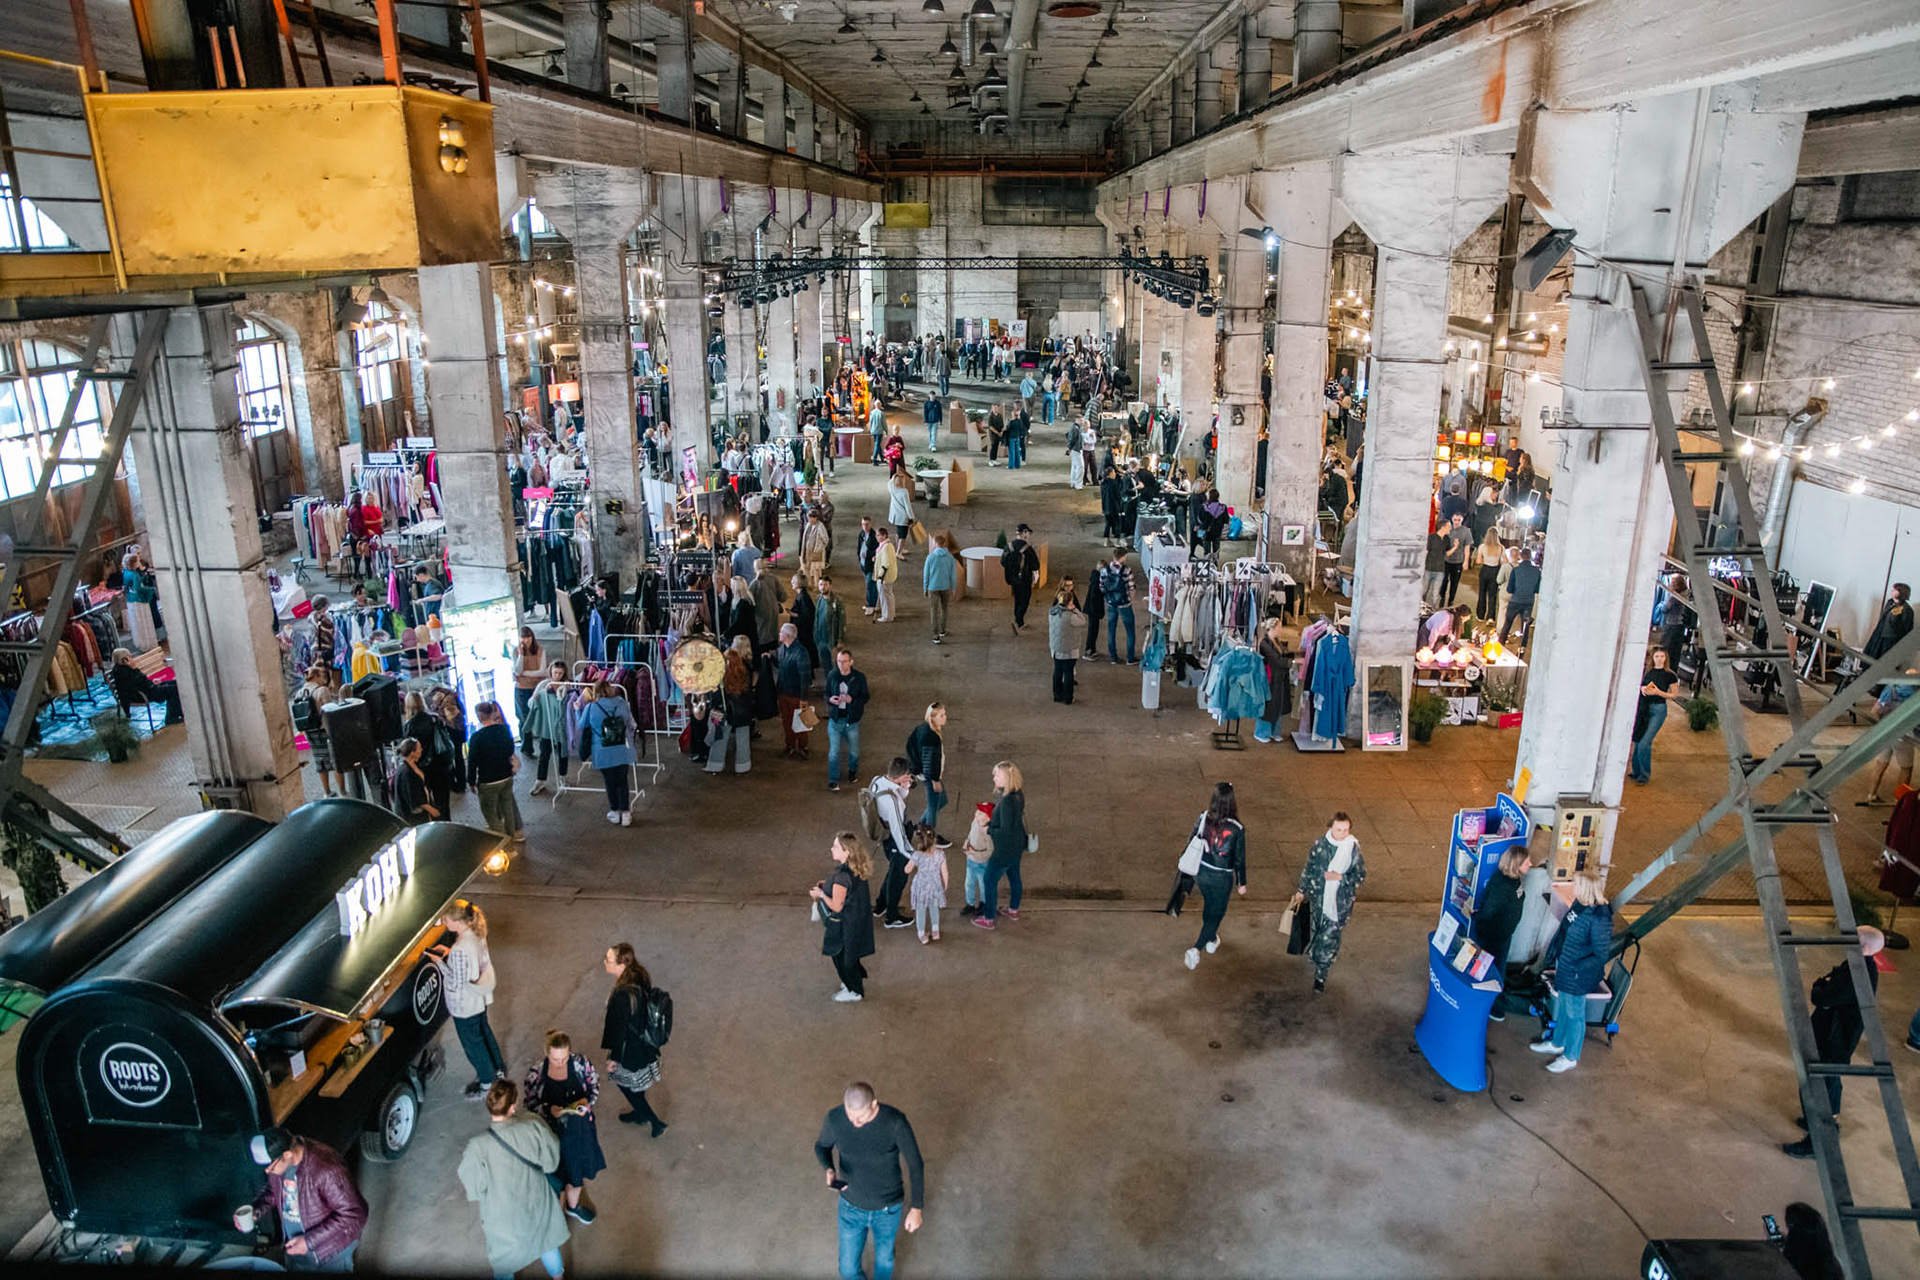
Design Street 2024, photo: Laura Palling
CREATIVE PROCESS
I began by compiling all available data and organizing it into four distinct groups based on related terms. From there, I sketched various visual representations for each group, exploring different design approaches. Once I had a few solid concepts, I transitioned from my sketchbook to Illustrator to refine the designs and determine the most effective solution. To ensure cohesion, I incorporated the festival’s color scheme and rounded shapes while adding my own creative touches for a unique and polished final look.


FINAL VISUALS
The final visualizations show data on Design Street's participants' heritage, disciplines, materials used, and sources of inspiration. In addition to insights from the art market, an introductory data visualization provides an overview of the design festival, including its duration, locations, and key events.
Shared across the festival’s social media platforms, the designs built anticipation for the event while providing attendees with important information. The visual language blended in with the festival's already existing identity, while also introducing a fresh touch.